Electronic Inputs
1. Make a capacitive sensor to measure a physical quantity with your microcontroller.
2. Select another sensor of your choosing (temperature, microphone, etc.).
3. Calibrate each sensor and visualize data in the form of a table or graph. Discuss the relationship between the signals recorded by your microcontroller and the physical quantities that you're measuring.
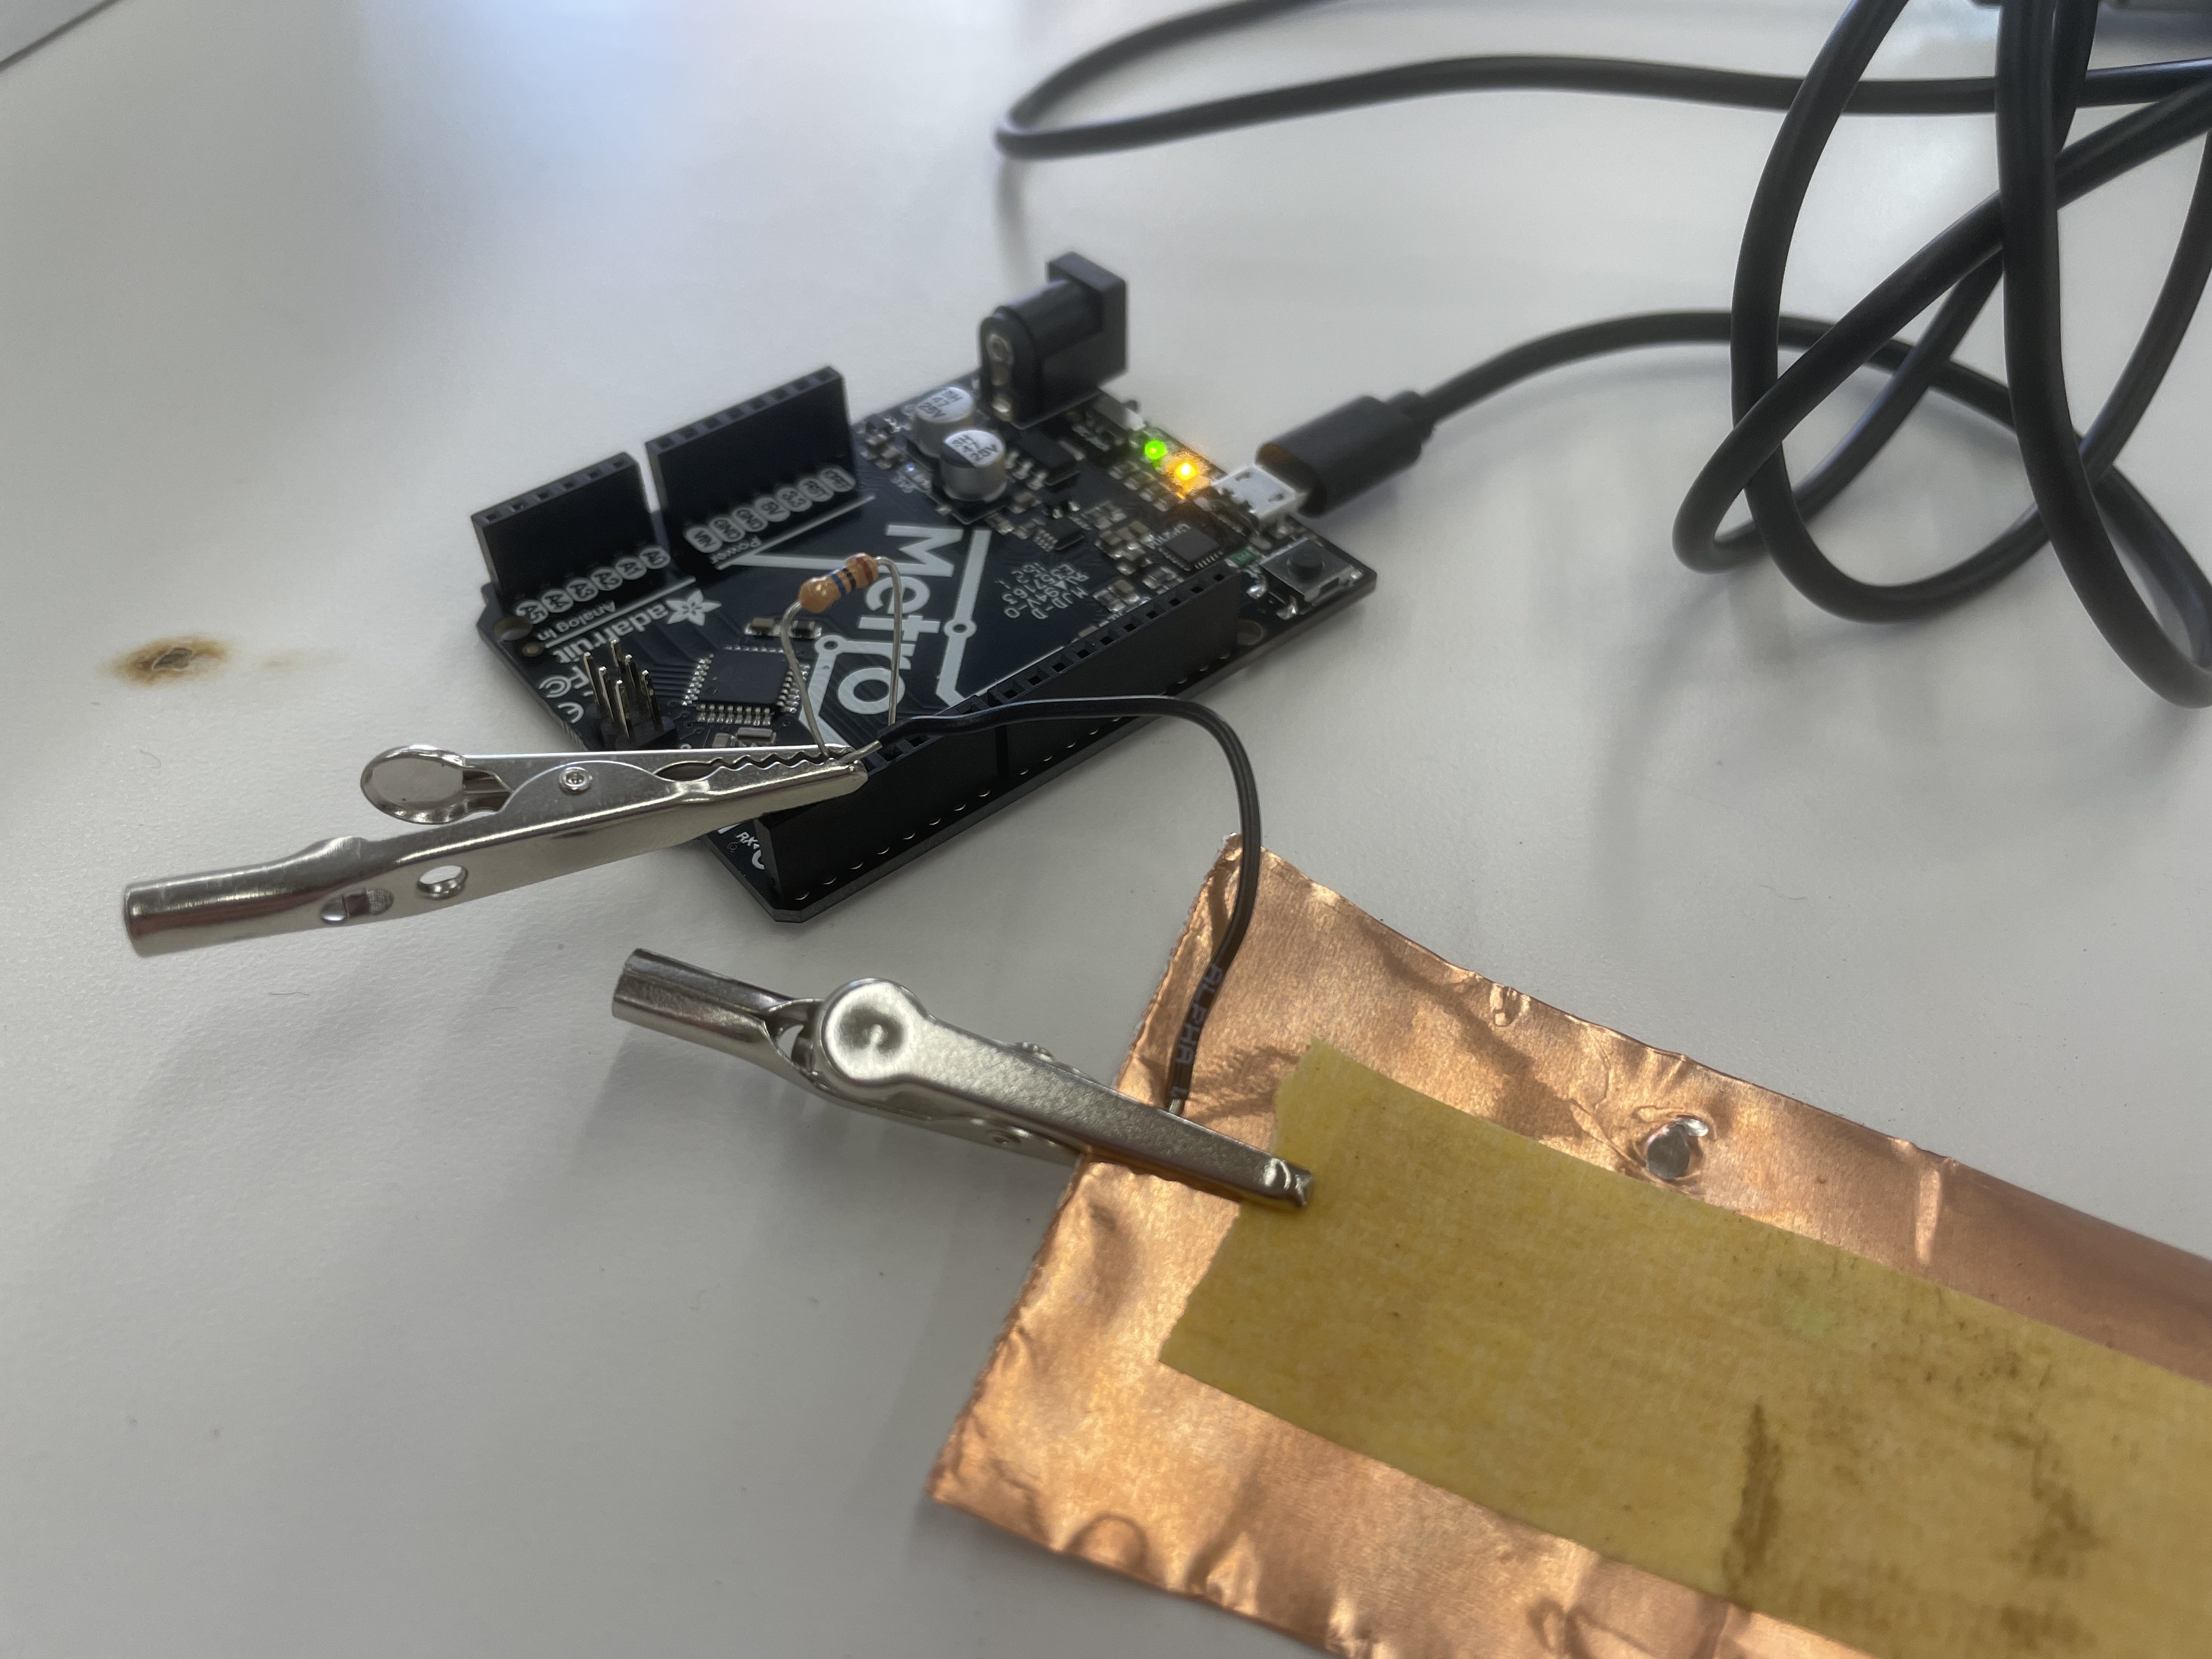
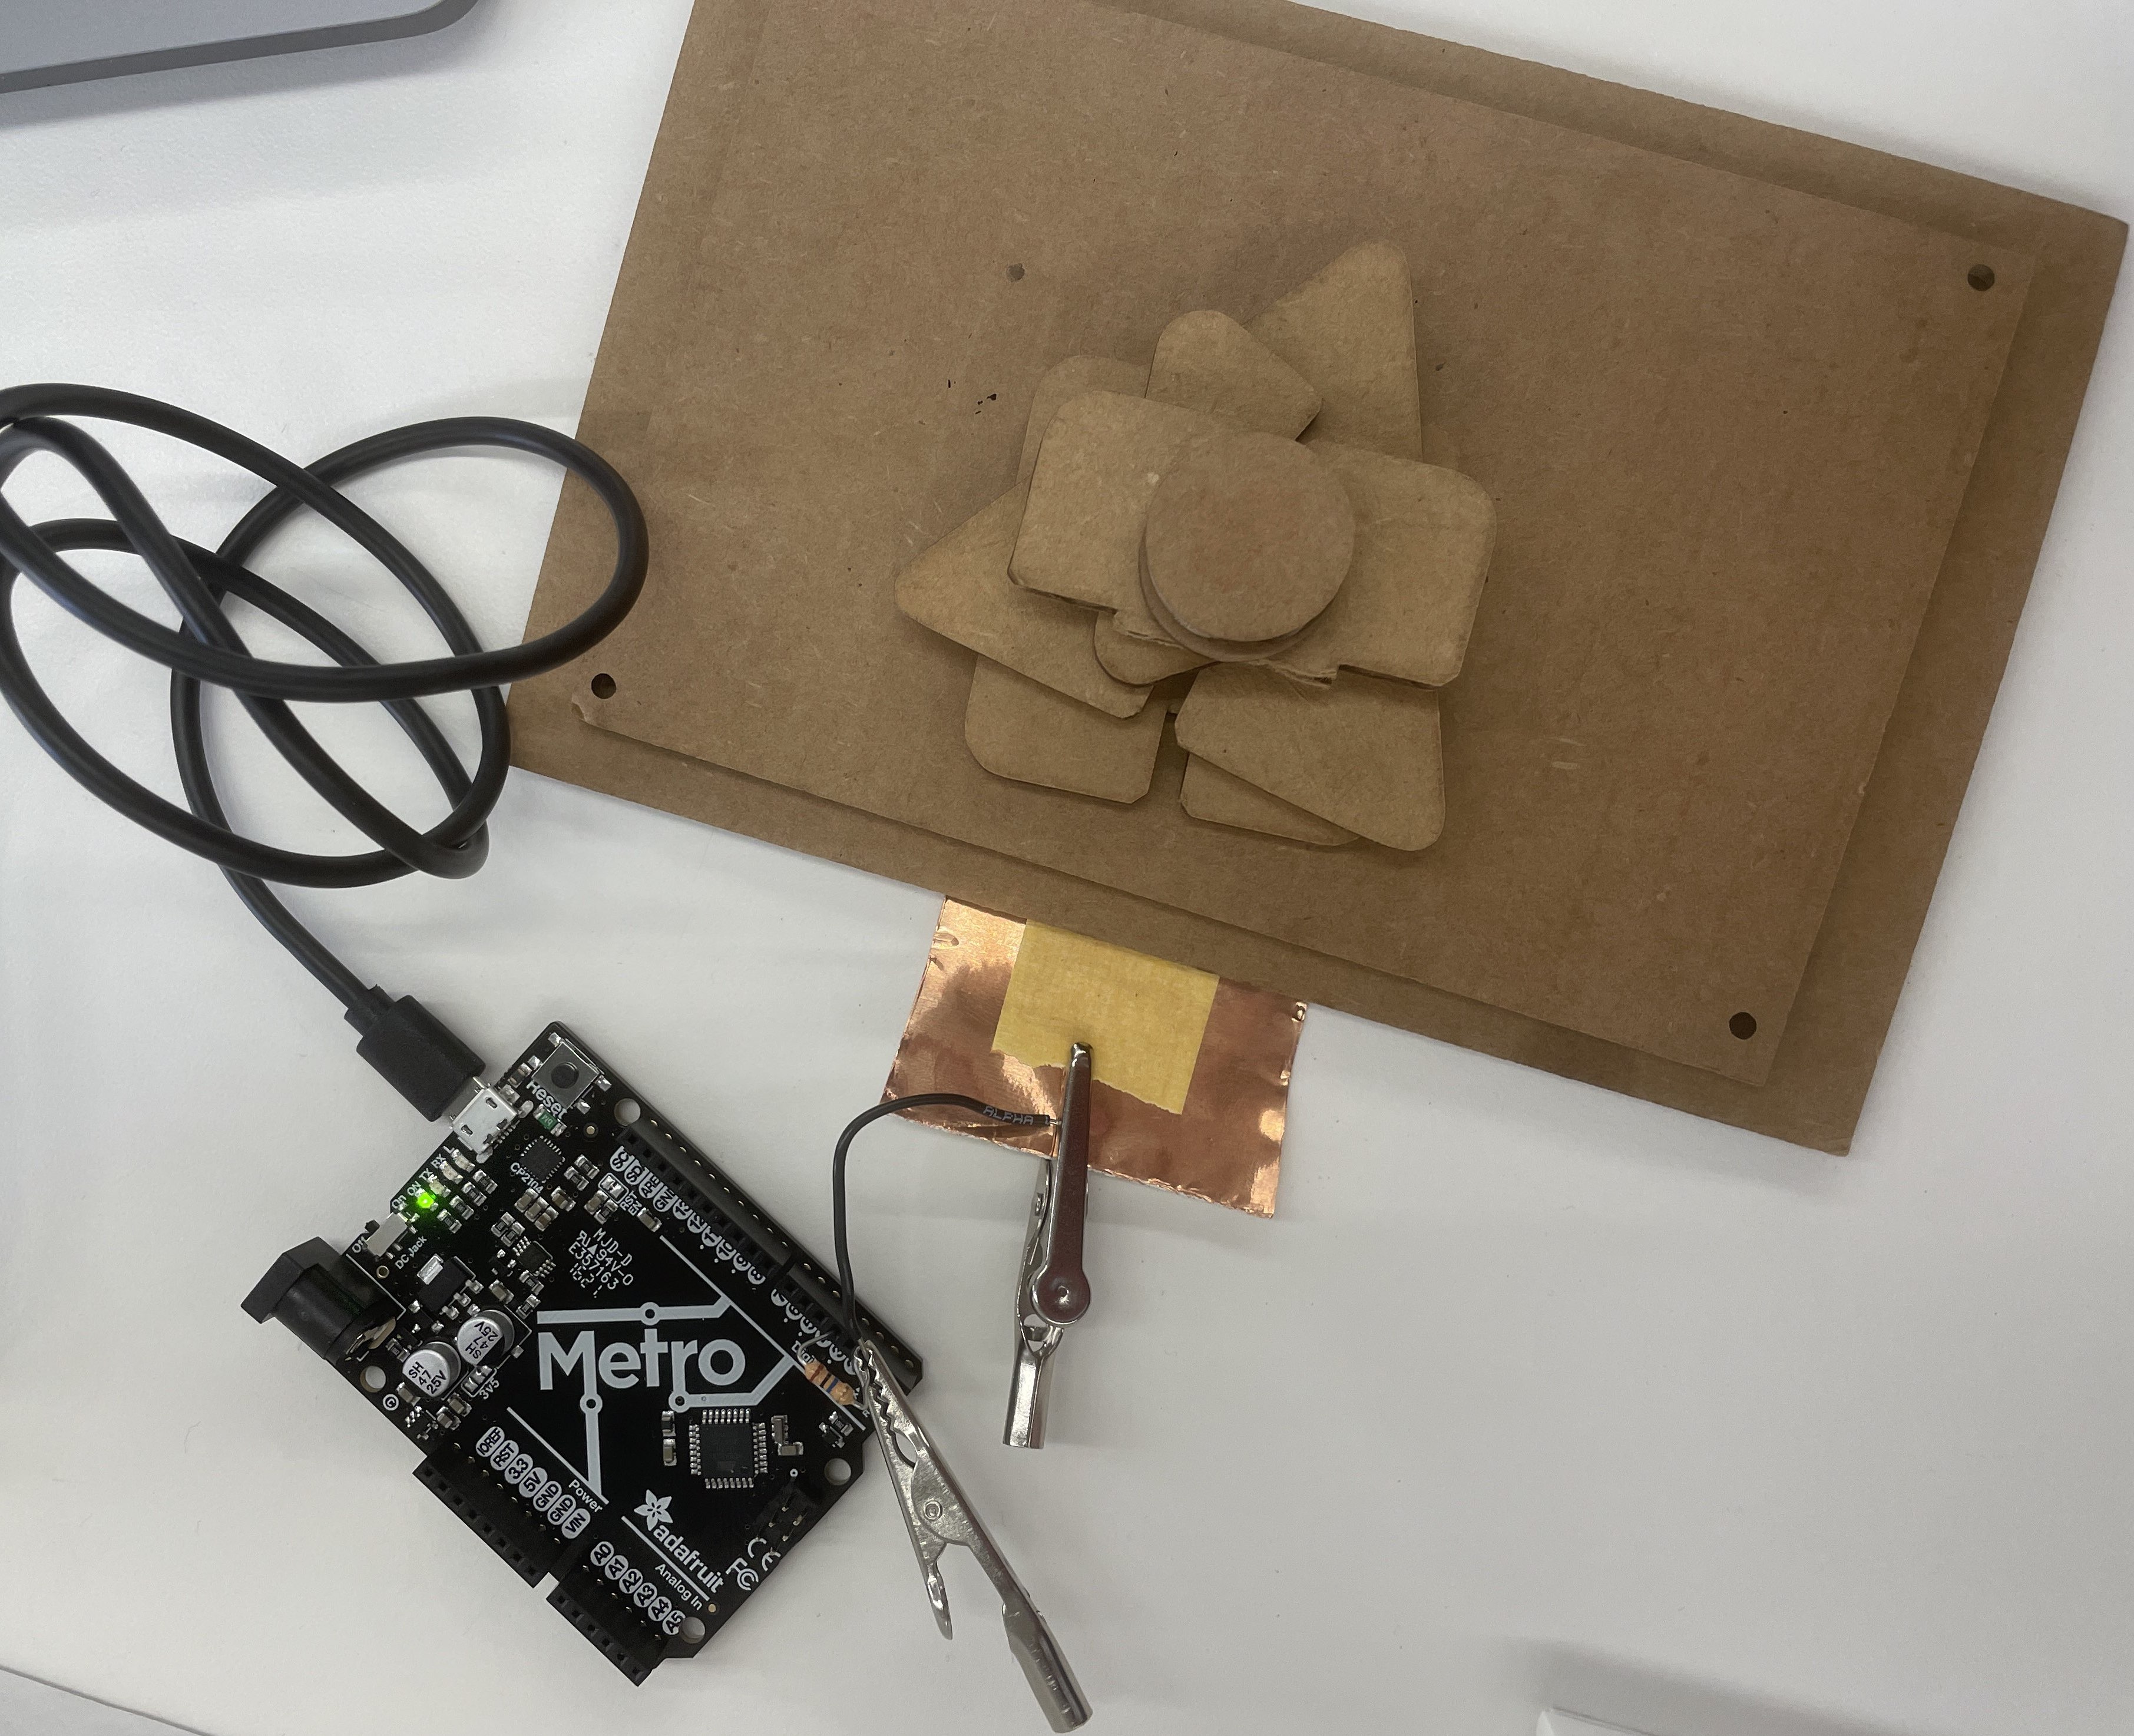
This Arduino Playground page and this example video were invaluable in understanding how a capacitive sensor works. Per the advice from the developer of the Capacitive Sensing library, I used a 10 megohm resistor between pins 2 and 4, then attached a piece of copper tape via a wire to pin 2. To calibrate the sensor, I used a stack of eight pieces of cardboard with my finger on top and removed one piece at a time.


Wiring, attachments with alligator clips, and the stack of cardboard scraps for calibration
Here's my code, slightly adapted from the example at the bottom of the Capacitive Sensor library documentation page.
#include <CapacitiveSensor.h>
/*
 * CapitiveSense Library Demo Sketch
 * Paul Badger 2008
 * Uses a high value resistor e.g. 10 megohm between send pin and receive pin
 * Resistor effects sensitivity, experiment with values, 50 kilohm - 50 megohm. Larger resistor values yield larger sensor values.
 * Receive pin is the sensor pin - try different amounts of foil/metal on this pin
 * Best results are obtained if sensor foil and wire is covered with an insulator such as paper or plastic sheet
 */

CapacitiveSensor   cs_4_2 = CapacitiveSensor(4,2);   // 10 megohm resistor between pins 4 & 2, pin 2 is sensor pin, add wire, foil

void setup() {
   cs_4_2.set_CS_AutocaL_Millis(0xFFFFFFFF);     // turn off autocalibrate on channel 1 - just as an example
   Serial.begin(9600);
}

void loop() {
    long start = millis();
    long total1 =  cs_4_2.capacitiveSensor(30);

    Serial.print(millis() - start);        // check on performance in milliseconds
    Serial.print("\t");                    // tab character for debug window spacing

    Serial.println(total1);                  // print sensor output 1

    delay(100);                             // arbitrary delay to limit data to serial port
}
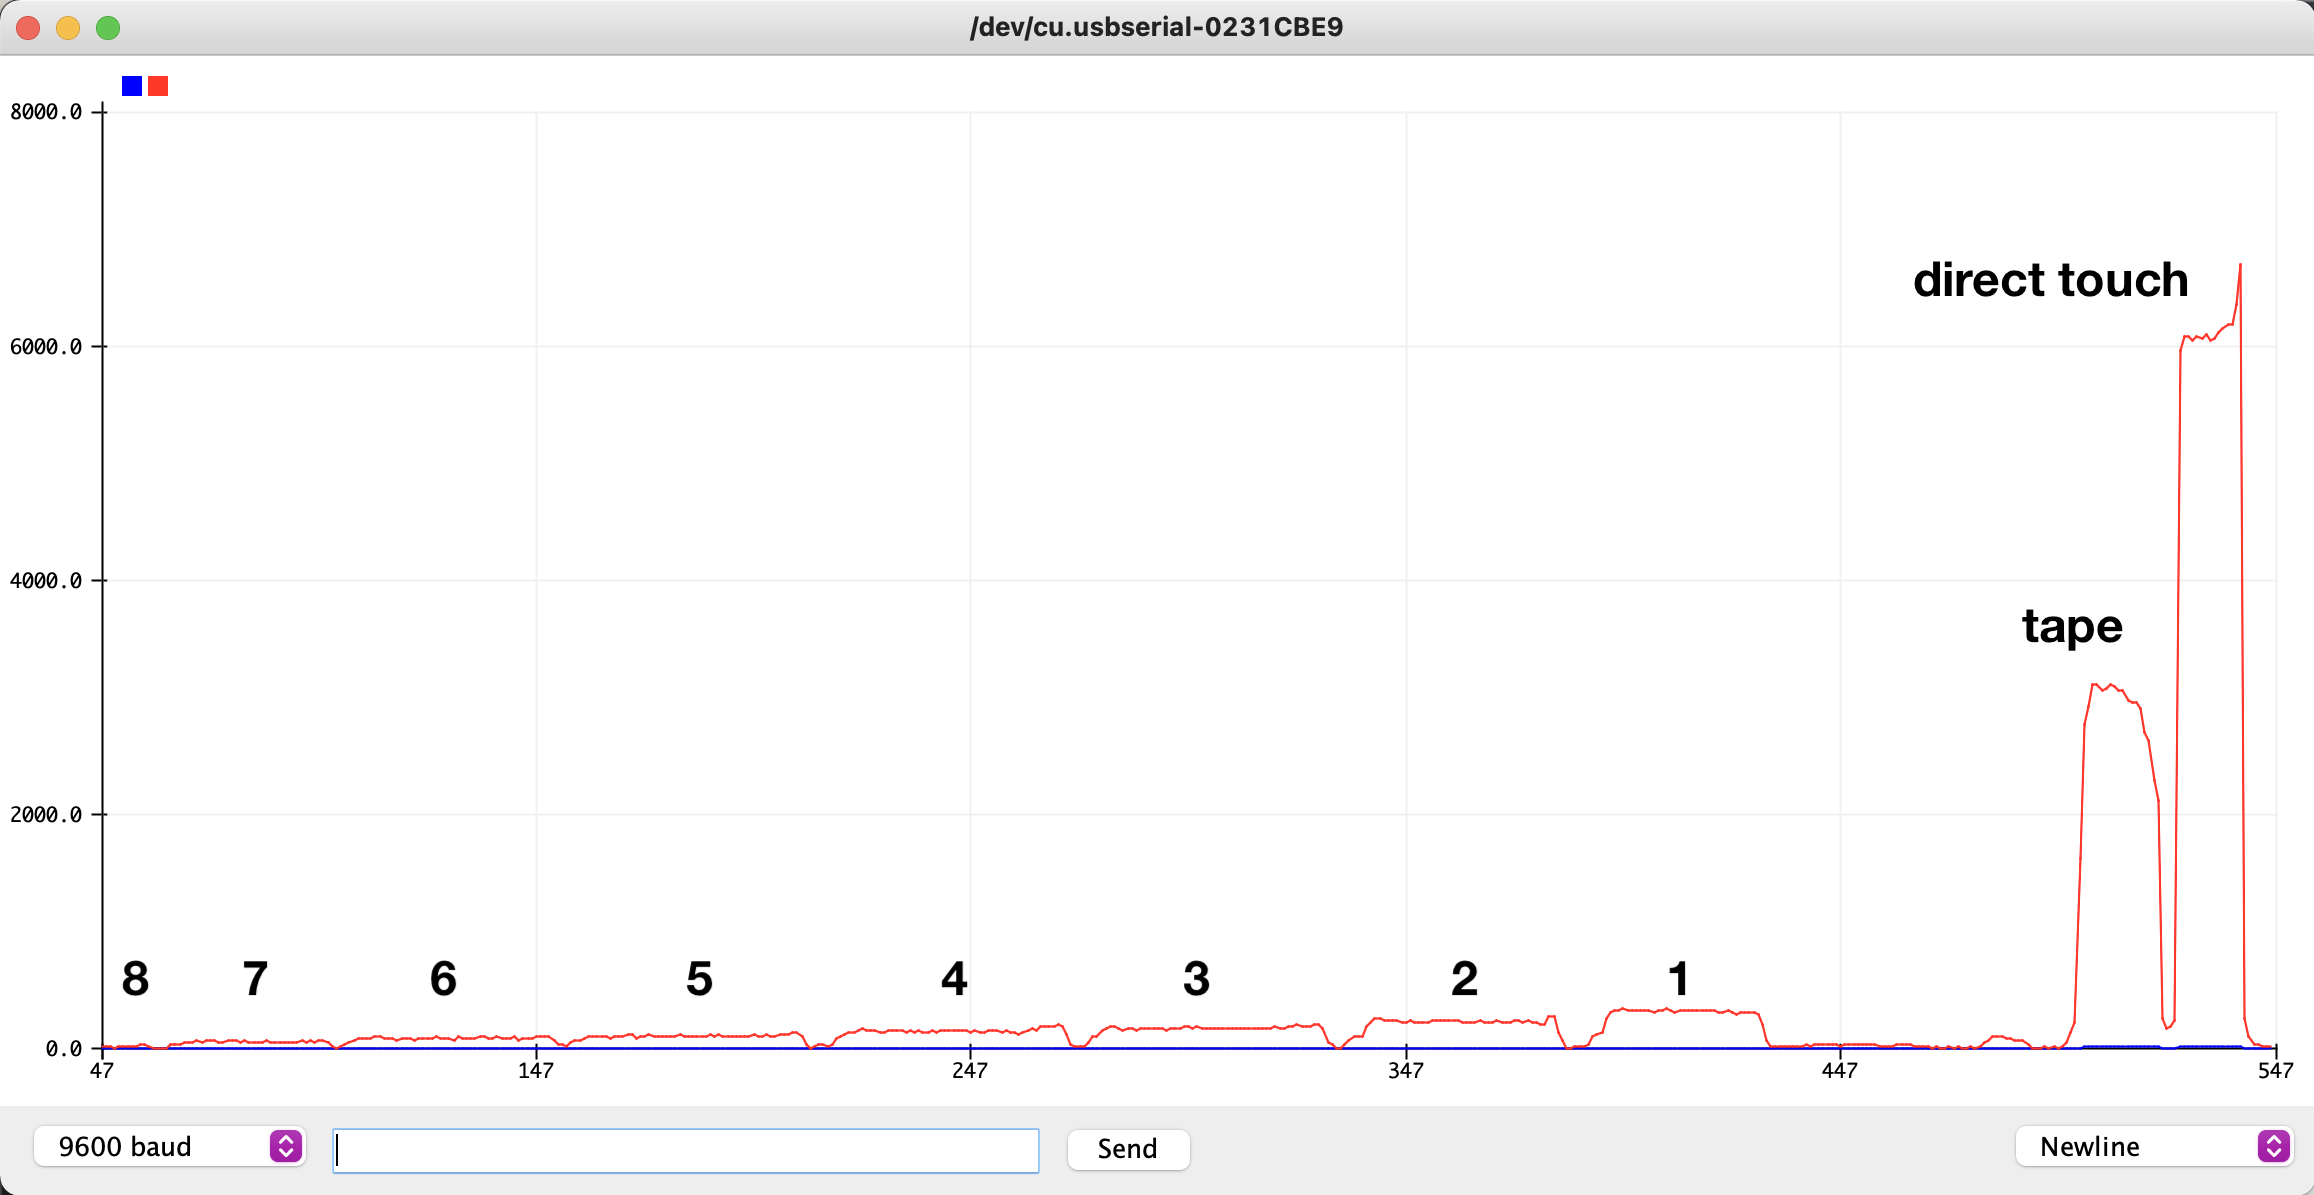
I used the Serial Plotter to get a nice graph. The slight jump at the end of each section is probably because I put more fingers/closer in order to take off a piece of cardboard, and the sharp drop is when my hand was away from the sensor.


8 pieces of cardboard to 1 piece of cardboard, then zoomed out to include one tape-height away and direct touch. y-axis is 0-400 then 0-8,000.
The signal is very clear, especially when differentiating between touch and no touch. One possible variable that changes the signal unintentionally is my laptop. The sensor setup is not grounded, which means that the large metal surface of my laptop housing ends up also acting as a capacitance sensor. When I wasn't anywhere near the sensor, it read at around 20-40. (according to the documentation, the sensor outputs "arbitrary units.") When I put my hand on my laptop but not by the copper tape, it went up to 130-150. That's a noticeable change when I'm looking that closely, but compared to the 6,000+ of a direct touch, it's negligble.
I'm not sure whether I'll use a capacitive sensor like this in my final project, but I'm confident that I understand how they work.
I chose to measure light with a phototransistor. I consulted the course site as well as this Shield-Bot tutorial to put together the circuit and understand how it works. I also used Digikey's resistor calculator.

Diagram of my setup, made with www.circuit-diagram.org, and the actual benchtop setup with messy-but-functional wires.
To calibrate the sensor, I pointed my phone's flashlight at the phototransistor from varying distances. I used a ruler held upright (hammer for weight) and measured the voltage from the 12-inch mark to the 2-inch mark. The phototransistor was 1 inch from the bottom of the ruler. I did two trials, shown with the blue and red dots below. With a 10k ohm resistor, the sensor is most sensitive in the 5-9 inch range, which is actually 4-8 inches above the phototransistor. Outside of that range, it still changes, just with less sensitivity. Since the Arduino is providing 5V, it makes sense that the measured voltage always stays between 0 and 5V. The ambient light in the classroom registers 0.20V.
| Ruler (in) | Trial 1 (V) | Trial 2 (V) |
|---|---|---|
| 12 | 0.54 | 0.73 |
| 11 | 0.54 | 0.73 |
| 11 | 0.63 | 0.81 |
| 10 | 0.65 | 1.04 |
| 9 | 0.7 | 1.23 |
| 8 | 1.43 | 1.54 |
| 7 | 1.81 | 2.03 |
| 6 | 2.54 | 2.72 |
| 5 | 3.72 | 3.69 |
| 4 | 4.7 | 4.85 |
| 3 | 4.88 | 4.89 |
| 2 | 4.93 | 4.91 |